Here in Ithaca, we just set a record for active Covid-19 cases and people in hospital. Nationally, the US is also setting records. Things are getting worse in every state except Mississippi.
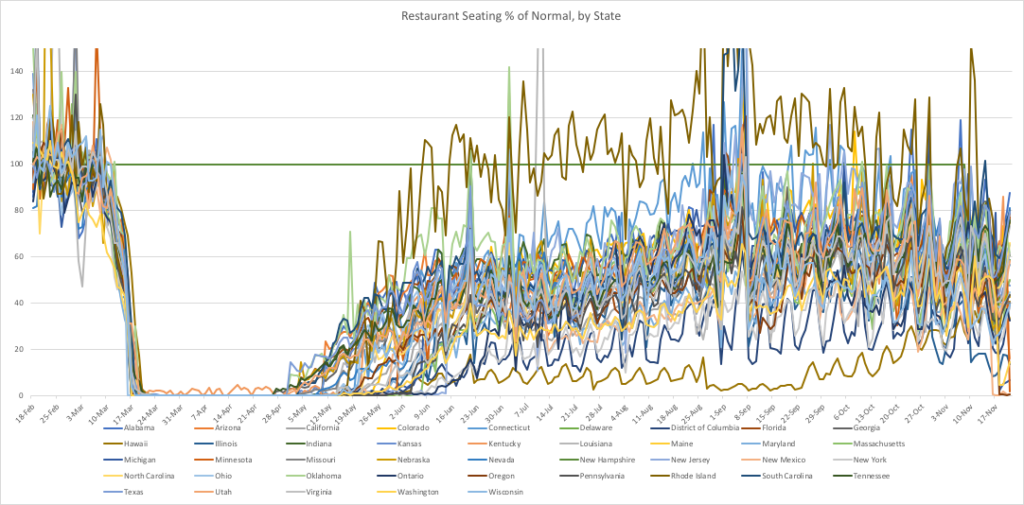
Globally, much of Europe is shutting down. Meanwhile, the US is chugging along about like normal. OpenTable shows restaurant seating declines in a few states, but most are about the same as a few months ago.
Back in March, I posted a link that talked about how fast Covid-19 will hit. It’s worth revisiting, since conditions probably will be like that again, and soon. Except, this time it’s starting from higher ground. Most of the US is headed towards conditions that are similar to New York City last March.
My parents are in a nursing home in Cattaraugus County NY. It’s rural, just south of Buffalo NY. I check their Health Department website weekly, to get an idea of how things are going there. It’s the only nearby county with a write-up on every case: gender, symptoms, how they caught it, why they were tested.
The odds of catching Covid-19 are growing rapidly. It may outstrip the number of test kits (already happening in the Dakotas). So, I decided to put all the Cattaraugus data into Excel (633 cases), then do math on them. The results may be useful for anyone trying to figure whether they have Covid-19 or not.
60% of Cattaraugus cases are female, 40% male. 20% are health care workers or employees in hospitals or group homes. 47% reported close contact with a Covid-19 carrier. They may not have known it at the time. 8% caught it while traveling elsewhere. 92% were local transmission.
34% had no symptoms when tested (they may have developed some later).
On average, the other 66% reported 3.21 symptoms each. The most common were fever (43%), coughs (43%), congestion (36%), body aches (33%), and headaches (31%). 21% had loss of taste and/or smell. That’s the only one that is different from a bad cold or the flu.
14% had shortness of breath: the most scary sign, since most deaths are caused by respiratory failure.
Victims also reported the usual stuff: fatigue, sore throat, chills, runny nose, nausea, diarrhea, sinusitis, weakness, dizziness, chest pains, stomach pains, vomiting. Sneezing was rare: only 3 mentioned it.
UPDATE NOV 22: Cattaraugus had 52 positive tests on Nov 17. Then 30+ most days after that. Not surprisingly, they stopped listing details for every case and just give a summary now. I revised the percentages slightly, with a few days more data.
If you want one more way to track the pandemic, Carnegie-Mellon now has a website with Covid-19 maps. It uses Google and FaceBook data to track doctor visits, mask usage and other indicators.
Back in March, people changed their behavior very quickly. It happened in just a week or two, even before Governors shut down states. I’m curious to see if it happens again.
Dennis Kolva
Programming Director
TurtleSoft.com